


Twig Profiler plugin for Craft CMS 5.x
Twig Profiler allows you to profile sections of your Twig templates, and see the resulting timings in the Yii2 Debug Toolbar

Requirements
This plugin requires Craft CMS 5.0.0 or later.
Installation
To install the plugin, follow these instructions.
Open your terminal and go to your Craft project:
cd /path/to/projectThen tell Composer to load the plugin:
composer require nystudio107/craft-twigprofilerInstall the plugin via
./craft install/plugin twig-profilervia the CLI, or in the Control Panel, go to Settings → Plugins and click the “Install” button for Twig Profiler.
Or you can install the plugin via the Plugin Store in the Craft CMS Control Panel.
Twig Profiler Overview
Twig Profiler lets you record profiling information on chunks of your Twig template code, so you can see how long it takes to execute.
Configuring Twig Profiler
To use Twig Profiler, you’ll need to enable the Yii2 Debug Toolbar, since it’s what is used to display the profile information.
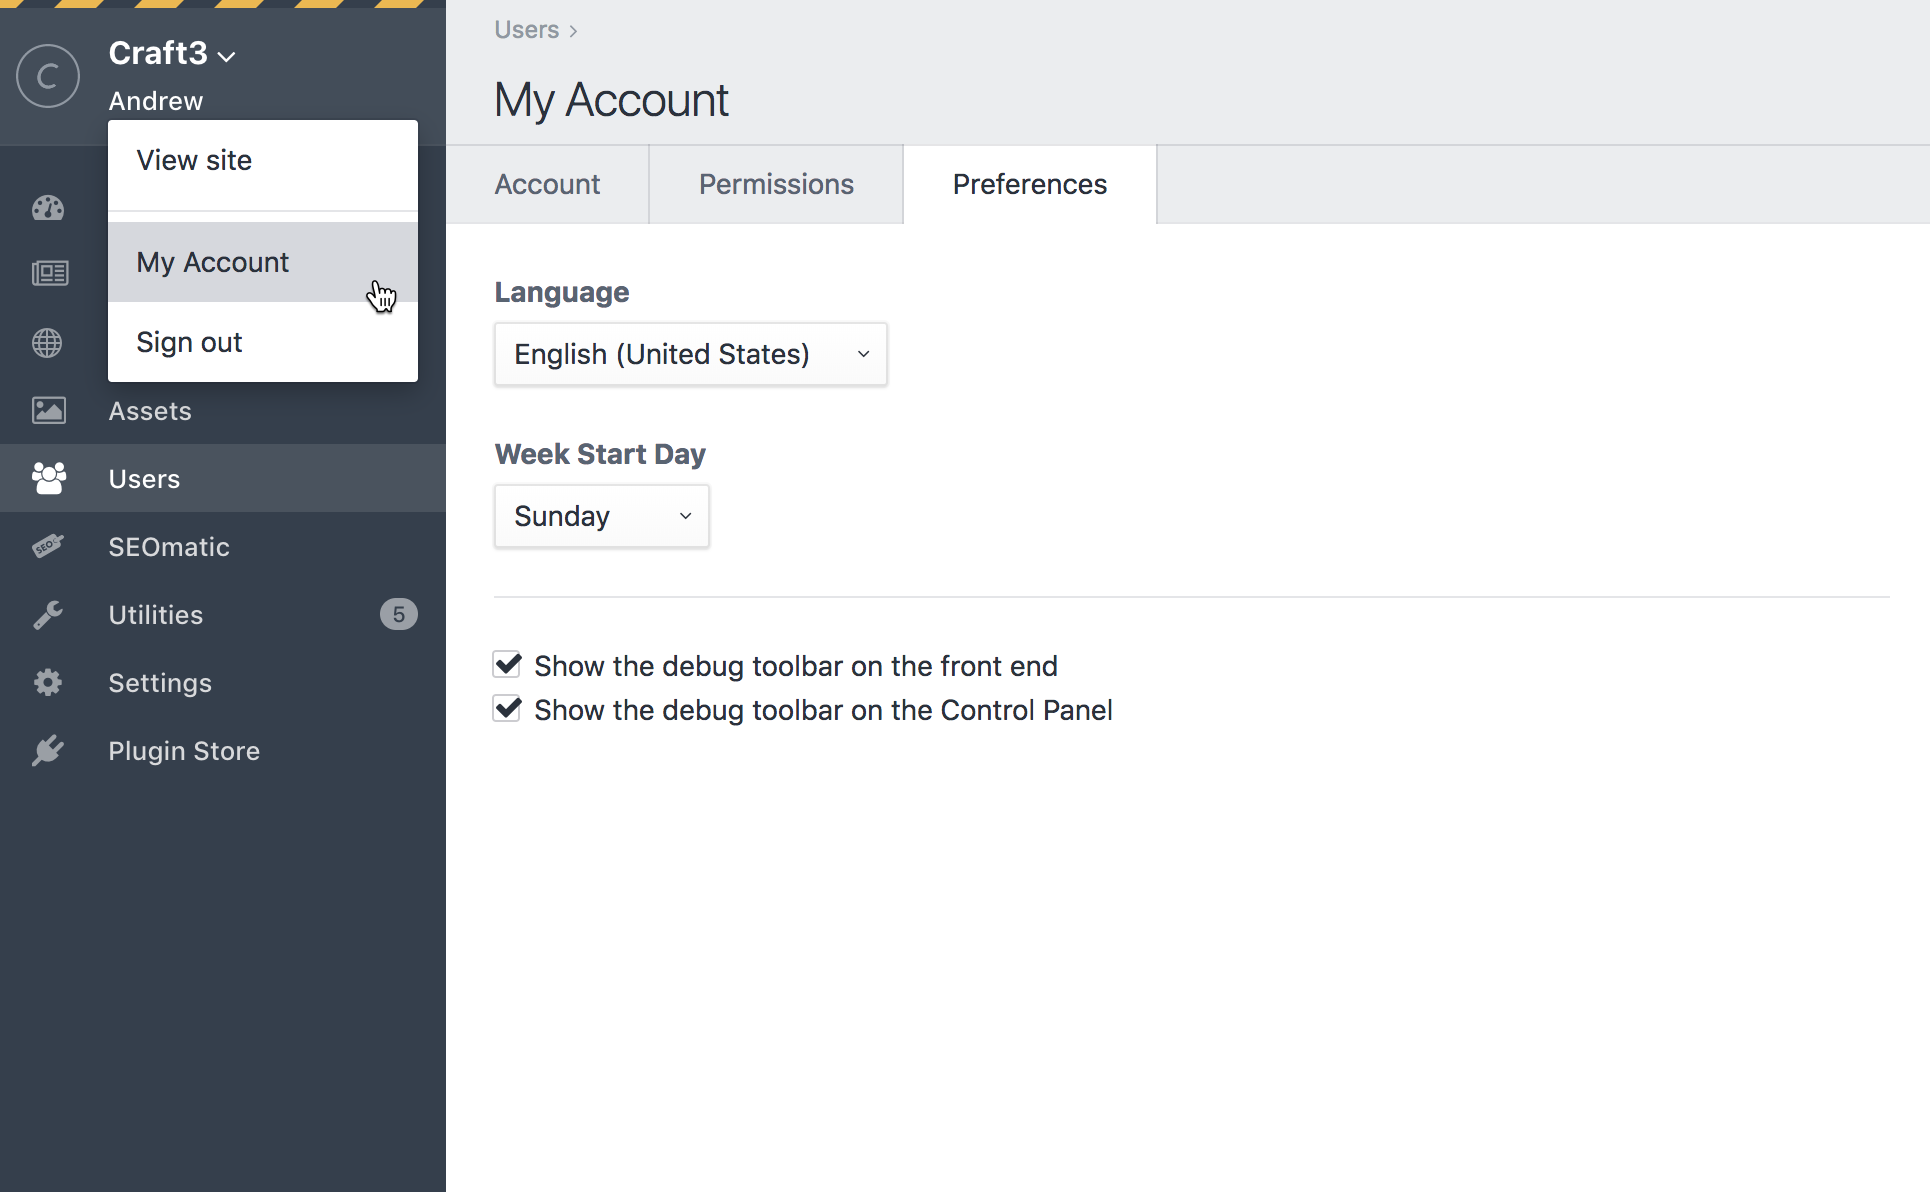
To enable it, go to the your Account page, and click on the Preferences tab. Then check the Show the debug toolbar on the frontend and/or Show the debug toolbar on the Control Panel checkboxes, depending on where you want the toolbar to appear.
You’ll then have the Debug Toolbar appearing at the bottom of your pages:

To learn more about the Debug Toolbar, check out the Profiling your site with Craft CMS 3’s Debug Toolbar article.
Using Twig Profiler
Quick Overview
To use Twig Profiler, just wrap any chunks of Twig code you like in:
{% profile "woof" %}
    {# code goes here #}
{% endprofile %}
The parameter you pass in (woof in the above example) should be unique per profile block, so you can identity it when looking at the profiling data.
Reload your page, and then click on the Time section of the Debug Toolbar, and you’ll see your profile data:
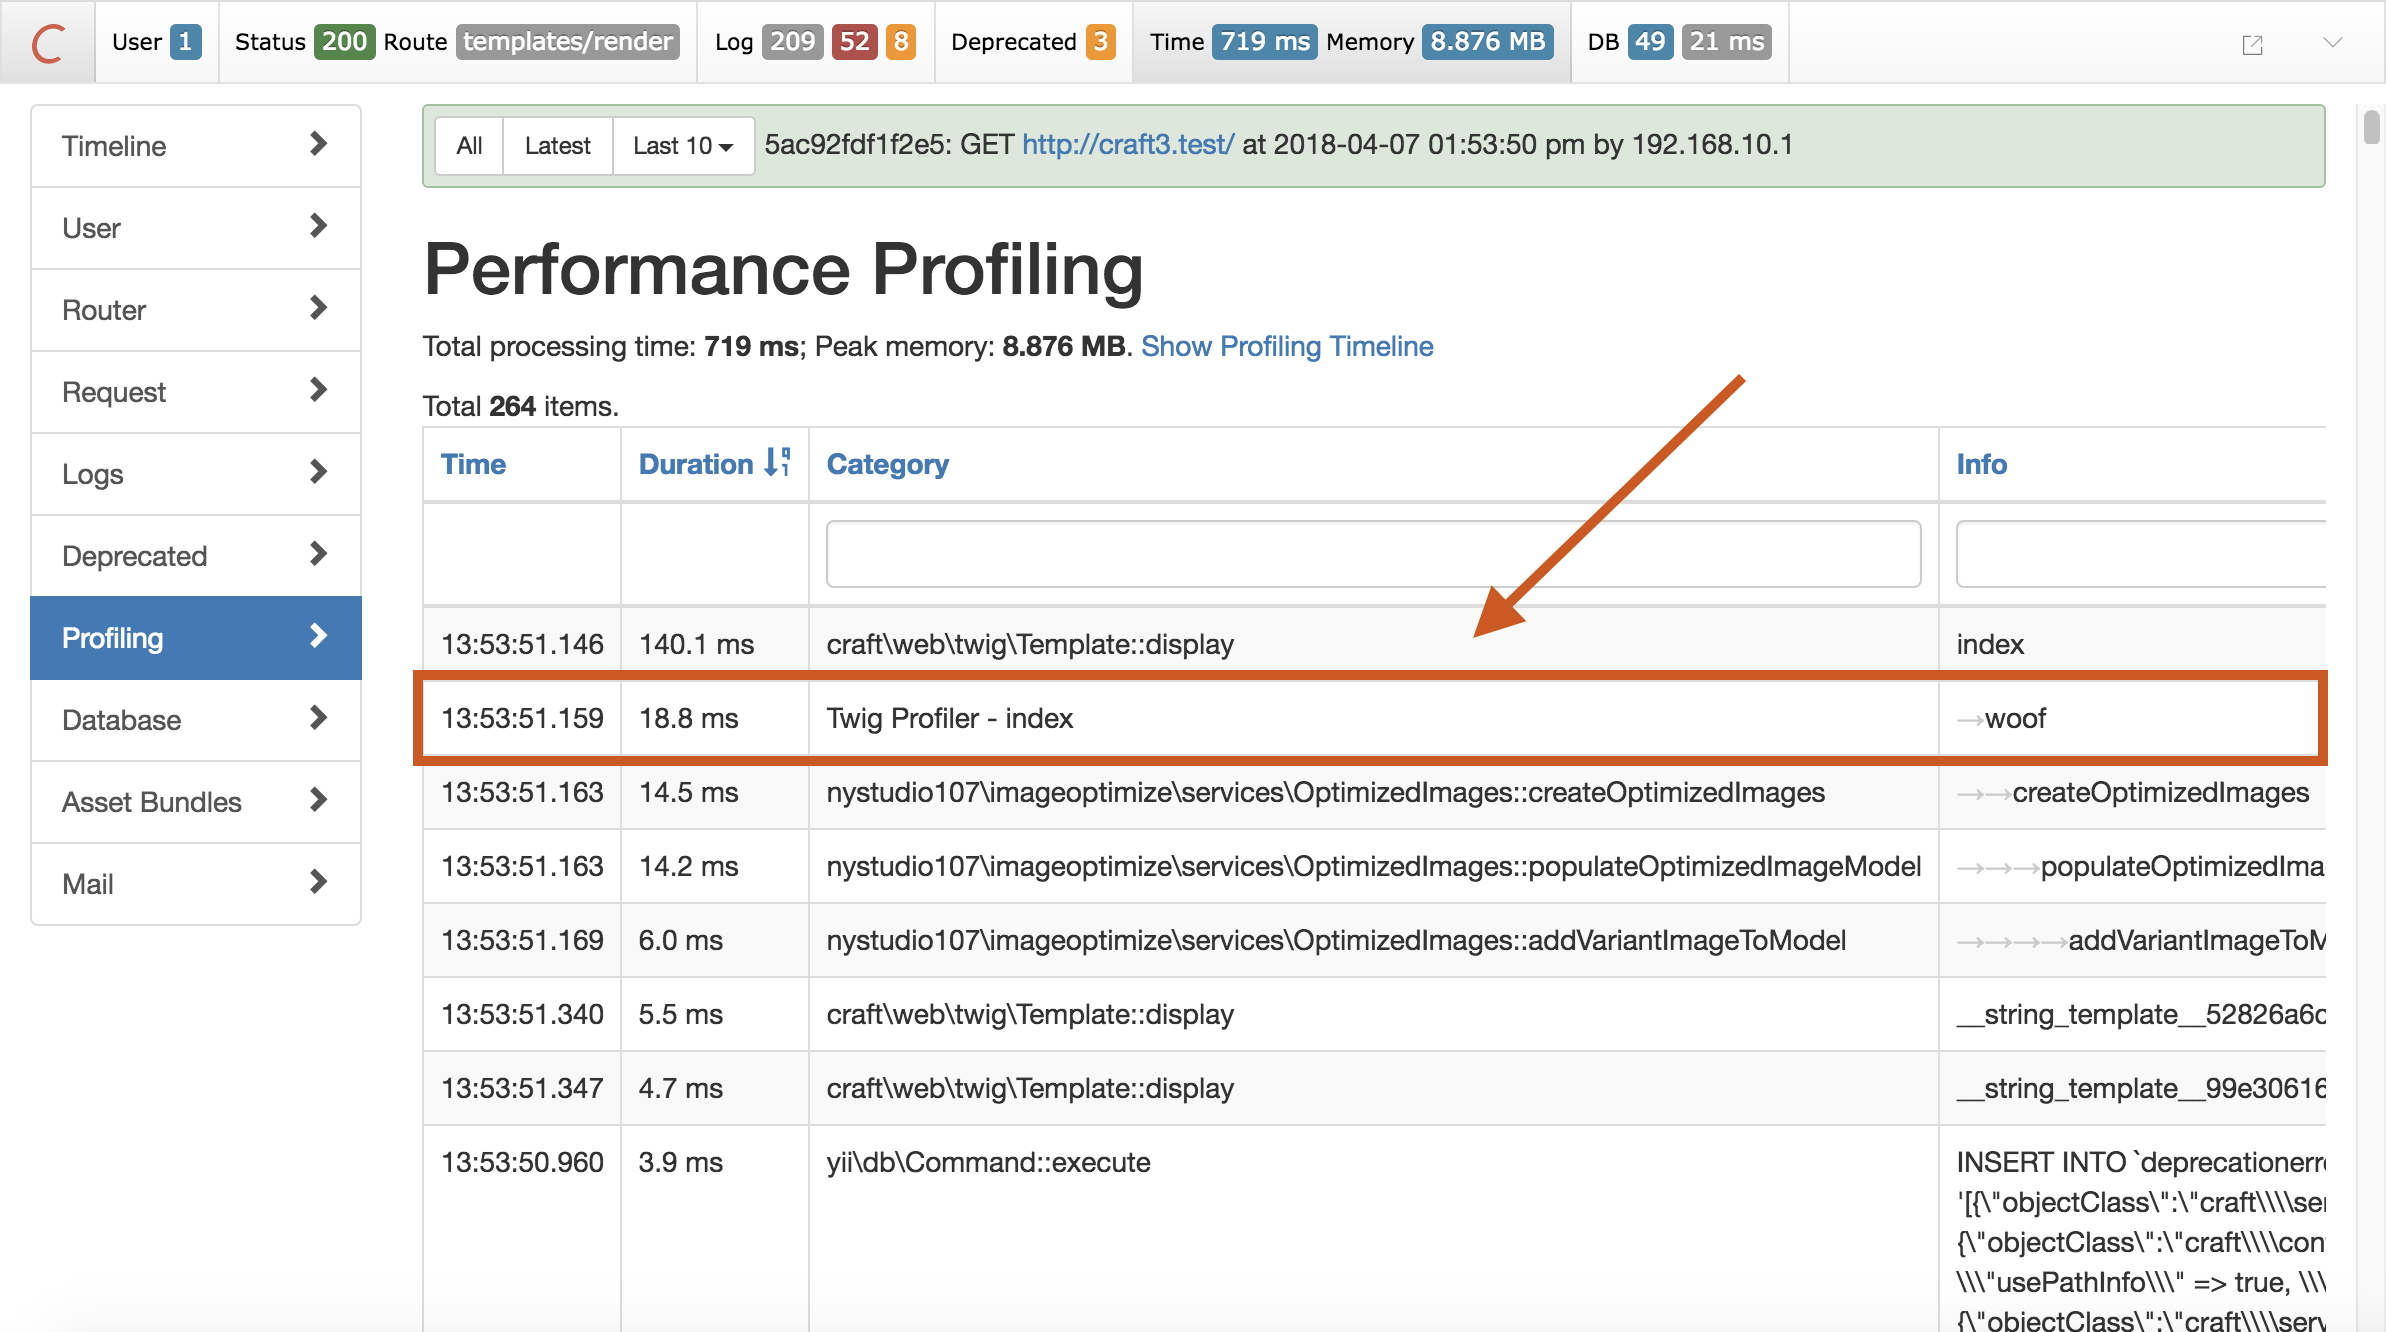
The Duration column shows how long it took to execute the chunk of code inside of the {% profile %} block.
The Category column shows the type of the profile sample, which will always been Twig Profiler along with the name of the template, for profile data collected by Twig Profiler.
The Info column shows the unique identifier we passed in.
You can filter the display to show only the Category or Info you want by typing into the text boxes above the columns.
Clicking on the Timeline section on the left will show you a visual timeline of the profile data:
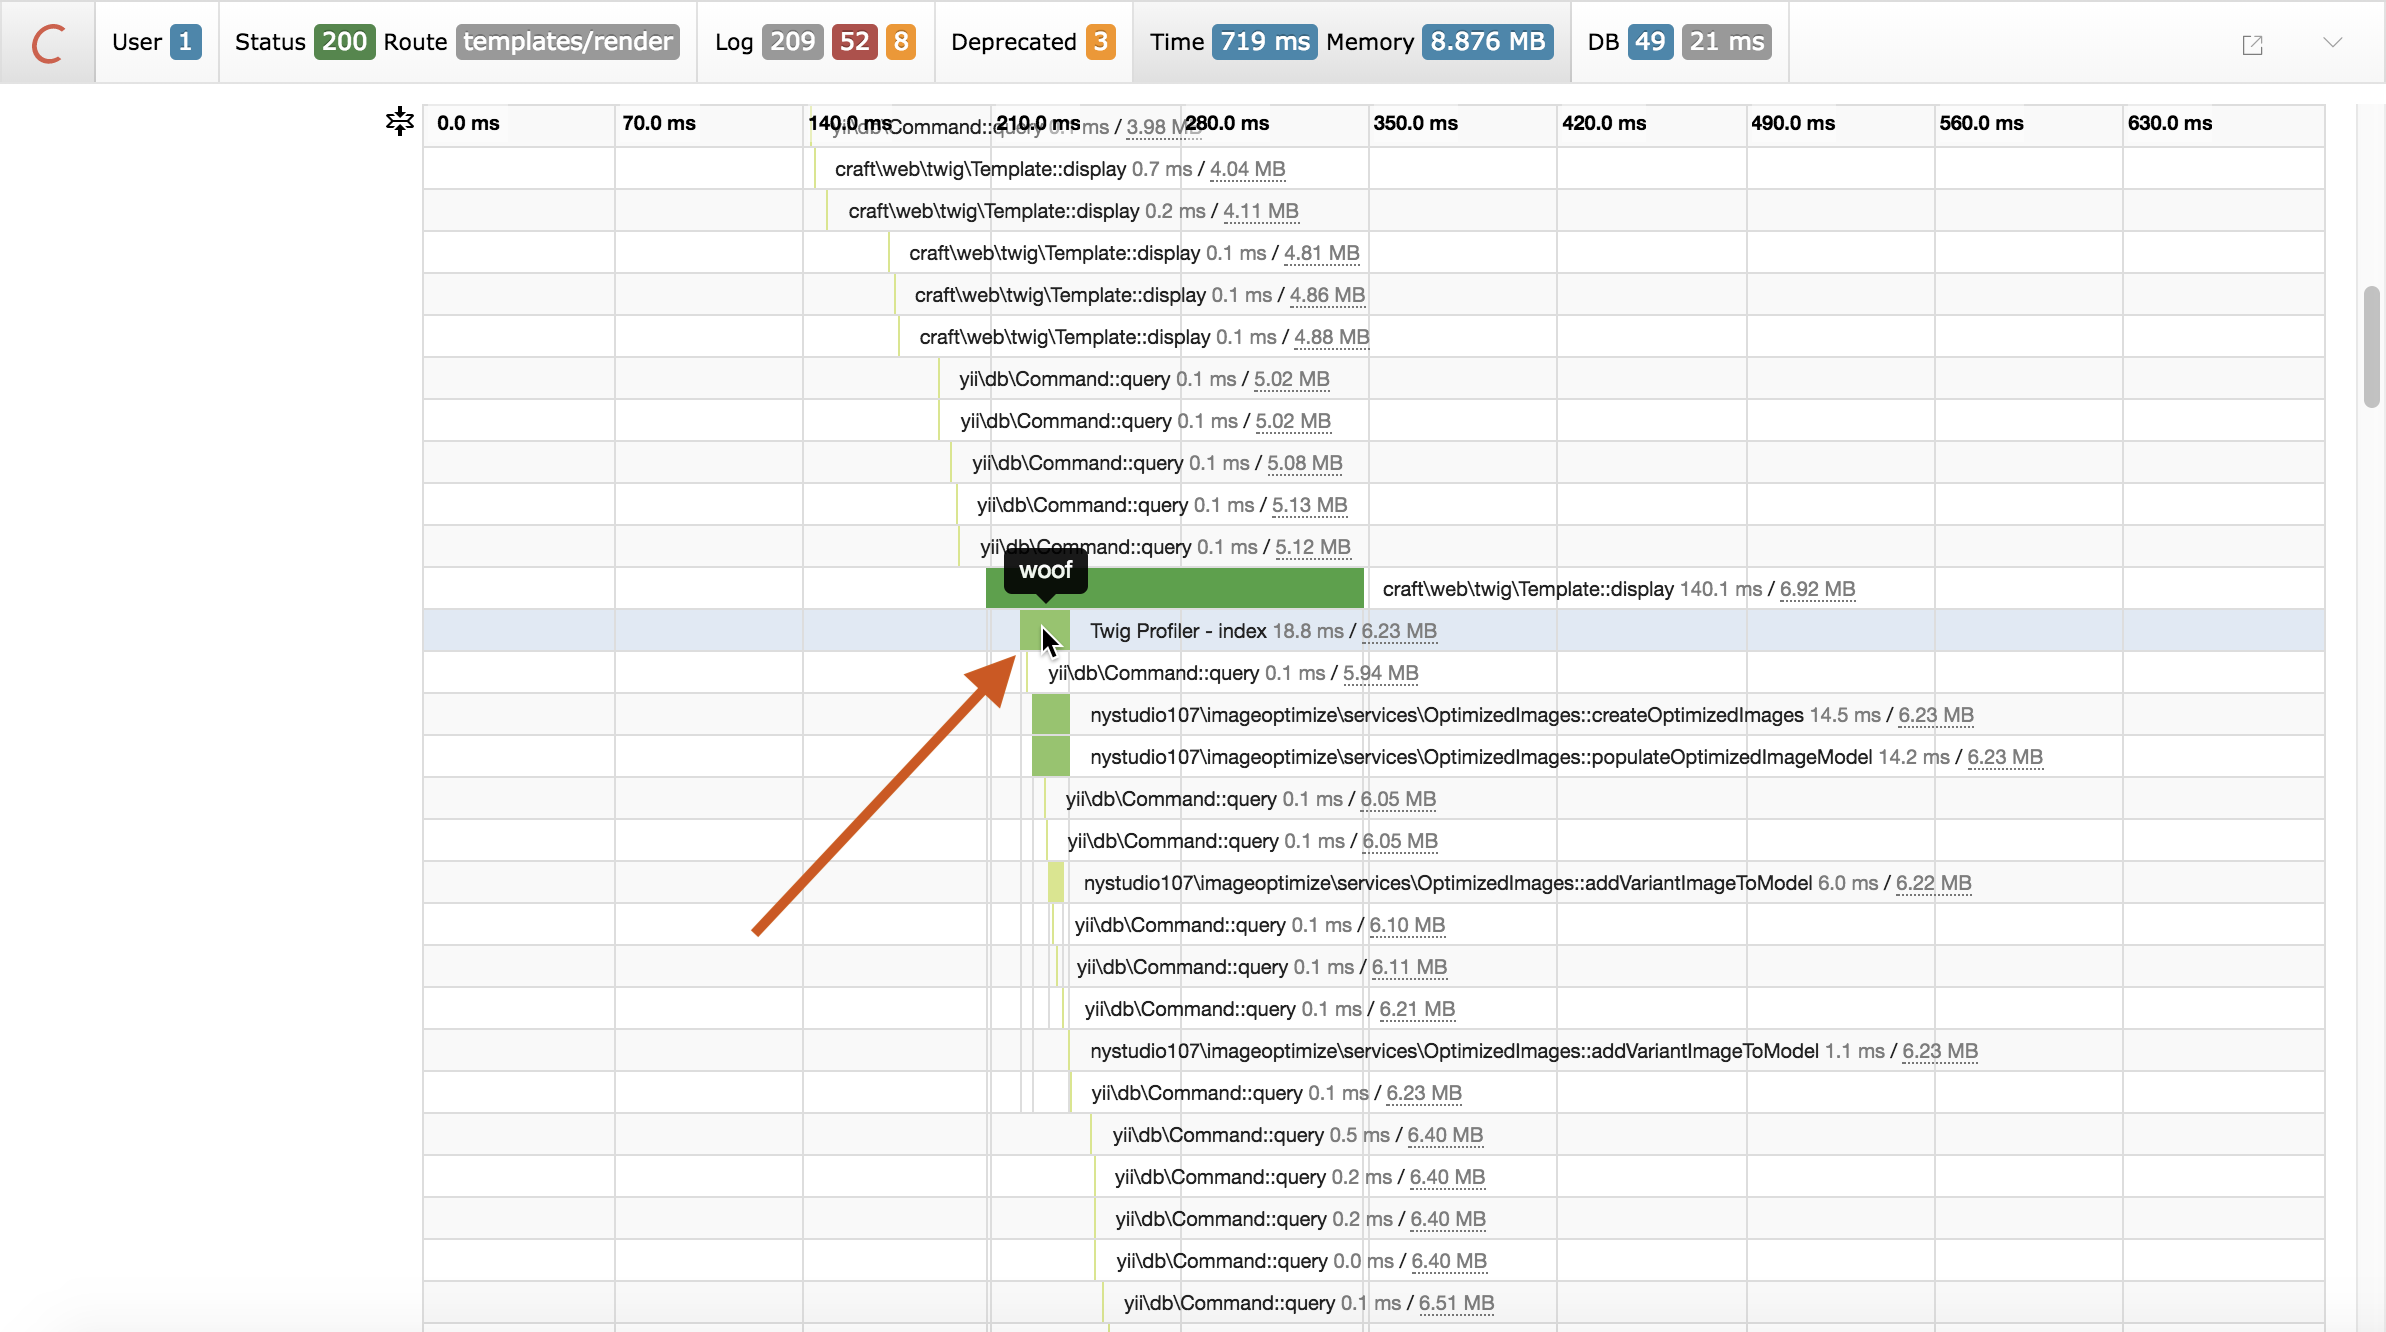
Hovering over the green sections will show you the Info identifier you passed in.
Pro Tips
You can have as many {% profile %} block tags a page as you like, and they can wrap around any Twig code you like (include, block, whatever).
You can nest {% profile %} block tags as much as you like.
Profile data is only collected when devMode is on. If you turn devMode off, the {% profile %} block tags do nothing, so you can safely leave them in your production code.
Under the hood, it uses the exact same method that Craft/Yii2 use to record profiling data.
Brought to you by nystudio107