
Link Pass the RUM
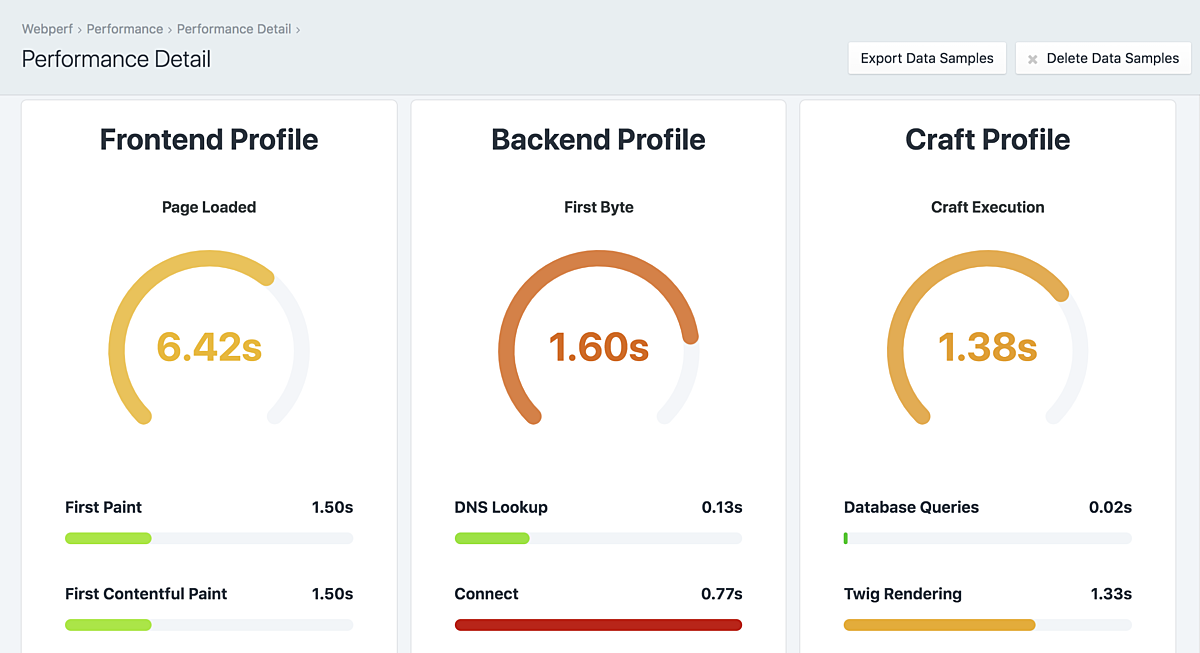
Webperf uses Real User Measurement (RUM) captured anonymously from actual visitors to your website to profile its performance. In this way, Webperf passively gathers and monitors how your website performs on real-world devices used by real-world users.
Webperf also gathers Craft specific information such as database queries, Twig rendering time, memory used, and overall TTFB (Time To First Byte) performance timings. Webperf will also record any front JavaScript errors as well as Craft CMS errors in one place for ease of discovery.


Link Insightful Graphs & Tables
Webperf then presents this performance information in concise graphs that give you insight into how your website performs. Webperf even provides you with bullet-pointed recommendations on how you can fix any performance problems that are found. And performance affects conversions as well as user experience.
Webperf leverages the the performance profiling that web browsers & Craft CMS already do. It has been optimized to minimize the Observer Effect, collecting data without impacting performance.
Link Error Tracking
Webperf will record both frontend JavaScript errors, as well as backend Craft errors in one place to make it easy to see where things go wrong.
The Aggregate Page Errors History chart shows you the history of errors for all of your pages on your website. Craft errors are in red, and JavaScript errors are in green.
The Aggregate Page Errors table lists all of the pages that have errors logged. The table is full searchable and sortable by clicking on the column headings.
It sure beats sifting through log files.


